Private Assets and the Future of Asset Allocation

December 16, 2021

Executive Summary

  • The macro setup implies a significantly higher allocation to private assets for many investors. In the near term, this accentuates the barbell of asset owners being passive in public markets with more of their active exposure via private markets.
  • However, we think private equity is set to disappoint current expectations, given record quantities of “dry powder” and buyout multiples, as well as the likely path of yields and challenges in deploying allocated capital. Fund selection is crucial and can add value within private equity given the very wide dispersion of fund returns relative to active public equity.
  • We show how the macro forces driving private asset allocation and the institutional reaction to this are, in a sense, a microcosm of the quandary for the whole investment industry. To properly address this, investors must assess the fundamental drivers of portfolio risk and the most efficient way to deploy risk and fee budgets.
  • If investors are allocating to private assets simply to get leverage or mask volatility, we think this is the wrong approach, requiring a rethinking of governance structures. However, this point raises deeper questions: What is the appropriate measure of risk when comparing liquid and illiquid assets? What is the appropriate frequency for marking to market when investing for a long horizon?  
  • Is ESG in conflict with the shift to private assets? The face-value answer to this question might be “yes,” but we think this is not necessarily so. Some of this tension can be resolved as responsible investing evolves, though new flashpoints are emerging, particularly on questions of social fairness. Much of ESG investing to date has been focused at the issuer-specific level, but we think this will increasingly be concerned with macro and policy questions. We discuss the likely evolving composition of private assets to include renewables and tokenized assets.
  • In a world of compressed Sharpe ratios, investors must use risk as efficiently as possible, so they need to be clear about which aspects of private asset return streams are attractive, decomposing returns to ensure that they pay only for those elements.
  • The action points for investors vary according to benchmark and regulatory constraints, but the conclusion for many investors is to buy more private assets while shifting the mix away from private equity. Specific potential allocations include private debt, real estate and green infrastructure—and eventually tokenized real assets.
  • More fundamentally, the recommendation from a governance perspective is to deploy an investment policy focused on the most efficient way to allocate risk budgets and fees, while also considering the investment time horizon as a way to level the playing field in assessing private and public assets.

Private Assets: Demand is Growing

Introduction

The painful banality of lower future returns will force a continuation in the huge reallocation from public to private assets. However, we think that expectations for the advantages of private assets may already be too high in some areas—private assets are an important part of the future of asset allocation, but not a panacea.

The overall shift toward private assets, and the recognition of where that may disappoint, in some ways is a microcosm of the challenges investors face. The lower return outlook and changes in the investment industry, especially in the distribution of fees paid for active management in public markets versus private markets, point to the need for investors to consider the most-efficient uses of fees, risk and capital. And the categories used to segment these measures may need to be reassessed.

Growing Allocations to Private Assets

Private assets are the fastest-growing area of asset management—in both allocations and fees. We think the current macro environment favors further growth, for reasons we’ll detail in this note, and the evidence is clear in the allocation of capital and fees.

Indeed, we’re moving rapidly toward a world where many asset owners’ investments in public markets are via passive allocations, with most of their active investing in private markets. The current industry setup seems to suggest a certain inevitability in this dynamic, but we don’t think it’s the most efficient way to think about allocating risk. In fact, we think the active-passive, private-public split is a mistaken one.

Institutional investors’ allocations to private assets have been growing steadily for years (Display 1), with the combined exposures to real estate, private equity and infrastructure now standing at 22% of a typical portfolio.

The greater presence of private assets is even more stark in terms of fees, driven by growing allocations to higher-fee alternatives (of which private equity accounts for the lion’s share) and a reallocation to ultralow-fee passive funds within public markets. As a result, alternatives now account for 46% of fees paid for asset-management services (Display 2). 

If private assets are the fastest-growing allocation component, ESG is the fastest-growing cross-asset theme, so the two must interact. So far, this interaction has led to explicit ESG pledges by managers of private assets. The next step is a more comprehensive assessment of the engagement aspect of ESG investing and how engagement with the management of underlying investments is possible across both private and public assets. Ultimately, though, an even larger theme is the renewable infrastructure aspect of private asset investing.

Allocations to private equity have been at the forefront of private asset inflows over the past decade, but we think the average investor in the average private equity fund will likely be disappointed. Private equity flows will remain sizable no matter what we say here, because the momentum is just too strong—several years of strong growth are likely in the near term. But the point of this note is to help asset owners think about where they should be steering their portfolios over strategic time horizons: we expect disappointment in private equity returns, and for the thrust of private asset investment to be elsewhere.

All this leads inevitably to broader questions of social fairness. The bedrock assumption in the post-war growth of modern finance and the principles of investing has been that public equity and public-debt markets were the primary way to meet long-term retirement savings goals. But if larger allocations to private assets are needed to meet return-diversification objectives, how will individuals or small investors be able to meet those goals, given the obstacles of scale and regulation within private markets?

In markets where individuals bear a lot of the responsibility for retirement savings, and if private assets need to be a larger presence in asset allocations, there are questions of fairness. Governments are incentivized to ensure that individuals can still buy a set of assets that delivers positive real return at an acceptable risk level, and this will presumably be a massive force behind setting regulatory structures to enable greater access to private assets.

Moreover, in a scenario that goes straight to the question of inequality, if only very-high-net-worth individuals can access private assets, there will be a political and social reaction—a point we’ll cover in later publications. We’re often asked what ESG means at the macro level: we see the accessibility question as one example of an emergent issue for investing with a social outcome in mind. It won’t be an issue for an individual asset or security, but instead at the overall portfolio level. Currently, this is not considered as being within the bounds of ESG investing considerations, but it should be.

The Case for Increasing Private Asset Exposure

In our view, the macro context for investing presents a broad case for increasing allocation to private assets, resting on five points:

  1. Low expected returns across traditional public markets
  2. Diversification becoming harder to come by 
  3. A strategic case for moderately higher inflation 
  4. The lack of listed "young" growth companies
  5. More-fragile liquidity in public markets 

We’ve laid out points one through four in recent work. The case for lower returns was set out in our recent quarterly; we covered the lack of diversification and its implications for portfolios in the chapter “Why the World Has a Duration Problem” in our black book Inflation and the Shape of Portfolios. The case for higher inflation was detailed in Assessing the Inflation Trajectory—and Portfolio Responses, and we analyzed the lack of “young” public market growth companies in the chapter “What Is the Point of the Stock Market (in a Capital-Light World)?” of the recent black book, Are We Human or Are We Dancer?

This work underlines a key point: an expected decline in Sharpe ratios from investing in traditional asset classes (Display 3). Even if the expected return from private assets declines from past levels, a higher allocation to those assets would be one response to fewer opportunities elsewhere. Of course, there’s a debate to be had about what the “risk” axis should be for assets that aren’t marked to market, for which some of the apparent low risk is illusory.

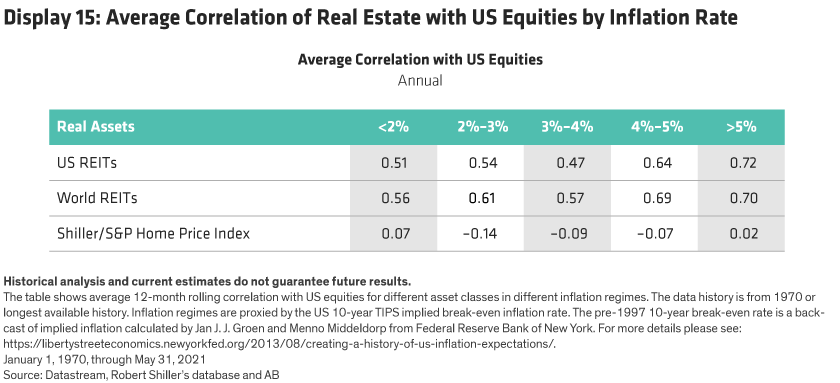
An increase in the strategic outlook for equilibrium inflation strengthens this case even more. Part of the inflation aspect relates to specific private assets that may be effective inflation hedges, such as real estate and infrastructure. But higher inflation is also likely to further erode overall expected real returns on a cross-asset portfolio, and it makes high-grade bonds less effective diversifiers of equity risk. These trends intensify the need for real returns and diversifiers. 

A Closer Look at Liquidity (or Illiquidity) 

Liquidity is a critical topic, but people mean different things by that term at different times, making it hard to define. Liquidity is the key to any comparison of public and private markets: it is, after all, probably the preeminent differentiating variable. In normal trading periods, liquidity in public markets has generally improved over the past decade (spreads have narrowed), but it’s more fragile for a host of reasons:

  • Changing market structure, with the growth of high-frequency trading (HFT), the rise of exchange-traded funds (ETFs) and evolving regulations leading intermediaries to take less risk
  • A dearth of active-value investors
  • Growing corporate debt
  • The risk, at some point, of a transition from quantitative easing to quantitative tightening

There’s evidence [see Nataliya Bershova and Dmitry Rakhlin, “High-Frequency Trading and Long-Term Investors: A View from the Buy Side,” Journal of Investment Strategies 2, no. 2 (Spring 2013): 3–47.] that HFT liquidity dries up when volatility is higher. Moreover, the rise of ETFs has pushed more market volume into a shorter period around the market close rather than volume being dispersed throughout the trading day. 

The general improvement in liquidity, most of the time at the expense of more fragile liquidity in times of crisis, could make tail risks more prominent across entire portfolios. The prospect of a market structure where even the supposedly liquid portion of a portfolio faces more illiquidity during economic stress has important implications: How much of a portfolio can be allocated to assets that may be unsellable at any price in crises? This risk must be built into governance structures for running portfolios. The possibility that public markets are more fragile can’t be easily shown, 1 but investment boards shouldn’t ignore it.

How much return should investors expect (or demand) for illiquidity risk? There have been a host of attempts to answer this. For example, Amihud (2002) 2 suggests that the illiquidity premium for illiquid versus liquid US equities is 1.3% annualized, using a model that compares long-horizon and short-horizon investors, with long-horizon investors spreading trading costs over longer time frames. 

Ang, Papanikolaou and Westerfield (2014) 3 link the illiquidity premium to the time horizon over which an asset can be priced and sold. The return that an investor demands on an asset should increase if the interval over which it can be priced is longer. Moreover, uncertainty about the length of the liquidity interval is a key determinant of the returns that should be demanded. So, for an asset that can by priced on a one-year horizon, investors should demand a relatively small excess return but for an asset that can be priced only on a 10-year time frame, the required return would be higher.

How does this illiquidity premium compare with other fundamental risk premiums? In Dimson's paper for the Norway pension fund (Elroy Dimson, Antti Ilmanen, Eva Liljeblom and Øystein Stephansen,  “Investment Strategy and the Government Pension Fund Global,” November 26, 2010), some of the most significant, very long-run risk premiums are estimated at 5.2% for the equity risk premium, 1% for the term premium, 0.4% for the credit premium and 6.1% for the foreign exchange carry premium. So, an illiquidity premium on the order of 1% isn’t insignificant from a return perspective. What’s more, most estimates of the illiquidity premium are derived from intra-asset-class returns, so they presumably underestimate a cross-asset-class illiquidity premium.

Ultimately, a discussion of liquidity needs to be tied to a time horizon, a topic too often regarded as an exogenous investing parameter. We think investors find it hard to change this view because it’s intertwined with questions of governance (often set up by a board or even public authorities through regulation) and career risk (that can’t be hedged).

But change is critical. In a world where maintaining risk-adjusted returns is more challenging, investors can’t afford to ignore any tools that improve their ability to meet liabilities. Therefore, we suggest that the time horizon of investment needs should be endogenous to the investment process—not regarded as written in stone and handed down by some higher authority.

At one level, this notion applies to all investment. There’s plenty of evidence that the time horizon of alpha decay varies across different strategies (Inigo Fraser Jenkins, Alla Harmsworth, et al., “Global Quantitative Strategy - Time-horizons in Finance: Bayesian trees for market allocation,” Bernstein Research, February 16, 2016), which is an even more critical consideration for a portfolio that spans public and private assets. Most investors need some portion of their portfolios in liquid assets to meet near-term needs, but pension plans, endowments, family offices and individual retirement savers can have sizable illiquid allocations. Maybe this didn’t matter over the past 30 years, when public markets were generating high returns and financial asset returns far surpassed real assets, but if that dynamic is changing (we think it is), the question of time horizon and liquidity matters very much. 

What’s the Real Risk Exposure with Private Assets?

The forces driving flows into private assets are a microcosm of broader questions for the industry. At a deeper level, a critical aspect of the inflows is what they mean for the way investors consider risk. What’s the best allocation to risk, and which parameters are most appropriate for apportioning it across different portfolio components?

Investors can seek exposure to certain fundamental risks for alternative or private assets that, ideally, are distinct and uncorrelated to traditional equity and bond market risks, such as equity beta and duration. These fundamental risks or sources of return include:

  • Illiquidity
  • Quality
  • Leverage
  • Risk premiums (factor risk)
  • Idiosyncratic alpha

It’s important that private assets genuinely carry risks along these dimensions—not just double down on risk exposures readily available via passive public investing. This is where innovation in the investment industry comes in. The price of buying factor risk has declined, and we think this will continue, so private assets must offer something over and above (and uncorrelated with) other risk premiums. Likewise, leverage might in theory be achievable in multiple ways, so merely being a vehicle for enabling leverage isn’t a sufficient excuse for investments like private equity.

A question must be asked: Are asset owners using private equity and other alternative investments to overcome what’s really a suboptimal governance arrangement? For example, consider asset owners who are only allowed limited leverage, or no leverage at all. If they’re allowed exposure to alternatives, they may be tempted to use it to obtain leverage—especially in a low-return, low-interest-rate environment like today’s. We see this as an incorrect motive for buying private assets or other alternative return streams, such as long/short investments.

One objective of our research is to make unashamedly normative statements. If some portion of private equity inflows are producing levered exposure to equity beta (or perhaps a permutation of the small-cap value factor), we think this misuses fee budgets and is an inefficient way to set parameters for risk budgeting. Instead, we suggest an honest confrontation with the governance structure. Changing these structures and investment policy statements is a lot harder, as it should be, but we see it as a more honest approach that’s likely to produce greater long-run benefits.

In recent years, we’ve developed an explicit framework for isolating the idiosyncratic alpha in active funds that invest in public equity and fixed-income markets (Alphalytics: Tearing Up the Rules on Active Management), return elements not readily available from passive-factor strategies. Processes like this are important in correctly apportioning risk and have gained immediate commercial importance with the collapse of passive factor fees in recent years (to just 4 basis points for US long-only equity factors in ETF format, for example). 

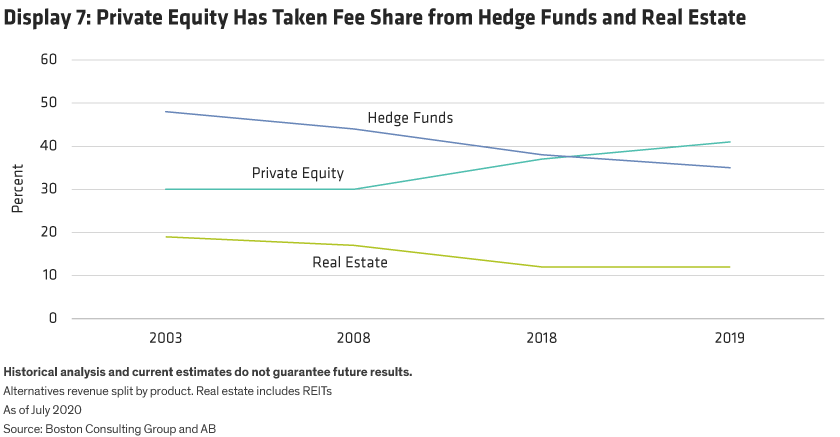
Now, these types of "passive" strategies for private investing return-stream components don’t readily exist today. However, the fee spread between active public funds and active private funds is stark, and the share of total fees paid has migrated to private equity. As a result, we expect that developing such alternatives to high-fee private assets will be a high priority for the asset-management industry, especially for private equity.

Another key aspect of the risk (and opportunity) of investing in private assets is selection alpha. To put it another way, the return dispersion among managers of private assets is much wider than for managers of public assets (Display 4). This presents an extra source of alpha if a fund selector can demonstrate a superior track record. 

Dimensioning the Future for Private Assets

Have Expectations for Some Private Assets Gone Too Far?

We have outlined a case for private assets, stemming from the investment environment of lower real returns, less diversification and fewer young growth companies coming to market. But are some parts of the private world vulnerable? Private equity has been the main beneficiary of the shift to private assets, but we think this is one area of private investment that has been overplayed.

Let's be clear: nothing we say in this note will arrest the momentum of the assets flowing into private equity over the next year. We also think that private equity most definitely has a place in portfolios. However, there is a question on whether expectations have moved too far and whether it is appropriate to make any marginal further increases in allocation. We think asset owners who are considering their strategic allocation should sit up and take notice of the case for lower returns on private equity in future than have been achieved historically:

  • The buildup of dry powder (committed but not invested capital) has led to higher buyout multiples, lowering future expected returns.
  • The history of high private equity returns was fueled by an incredibly favorable backdrop of declining yields, which is unlikely to continue.
  • An inability to rapidly deploy capital already allocated means that even the more modest returns implied by the first two points might not be within reach.

This note makes the case that given the macro setup, there is a case for increased private-asset exposure compared to history. In addition, a point that we have made in previous research is that the run rate of issuance of public equity is currently significantly lower than in the past (excluding special purpose acquisition companies at least) and when companies do list, it is later in their life. This means that the public market is relatively deprived of early-stage growth companies compared with earlier decades. This means that, ceteris paribus, there is a case for private equity being a more important way to earn the equity risk premium. Having said that, we make the case here that there are now other factors that likely curtail this exposure.

The buildup of dry powder has reached a record of nearly US$3 trillion (Display 5), which means more capital competing for a given number of investments. This state prompts a question: How many bidders are needed for a private asset investment before it becomes a public market investment in all but name?

The massive growth in dry powder (along with a decline in yields) has led directly to higher buyout multiples (Display 6). One can certainly be wary of valuation’s role as an investment signal in recent years, but—all else equal—a higher starting multiple does imply lower future returns over a strategic horizon.

Deploying allocated capital quickly has been an issue, too, with the growing stockpile of dry powder illustrating the difficulty in finding suitable investments, so even more modest returns may be unattainable. Actively investing the capital in some other way before deploying it could mitigate this challenge. But if the investment can’t be closely matched to private equity returns, it implies a different risk profile.

This issue might be glossed over at the moment in the rush to buy private equity exposure, but concern will grow, and is likely to fuel disenchantment with the asset class. This is an urgent development, given that private equity has grown to the point where it accounts for the lion’s share of alternatives fees (Display 7). 

We can use this data on the dynamics of private equity markets to scale the long-run return outlook based on key determinants: the starting multiple of private equity target companies and the path of yields (given the levered nature of the approach). The scale of dry powder is important, but only in the sense that it tends to raise the entry multiple for deals and impede the ability to deploy capital.

Any such model is necessarily constrained by a relatively small number of observations for aggregate returns—annual data over two decades, with each investment taking place over a multiyear horizon. Moreover, such a model doesn’t try to account for the difficulty of deploying capital, so these returns can’t necessarily always be met.

We can run a simple bivariate regression of five-year forward returns (net of fees) of US private equity funds against the starting median EV/EBITDA (enterprise value/earnings before interest, taxes, depreciation and amortization) target multiple at the beginning of each period and contemporaneous changes in a comparable US high-yield credit index by using the following formula: 

Private equity five-year forward return = a + b1 (EV/EBITDA) + b2  ∆ US High Yield credit yield

Over the period of 1998–2020 (Display 8), both beta coefficients have the expected negative signs—a higher starting multiple is associated with lower future returns, and rising credit yields are also detrimental to performance. 

So, with current buyout multiples at 11.4x, even with high-yield levels unchanged, this implies a five-year forward annual return of only 2.4% annualized, broadly in line with our expected inflation level. If the yield on high-yield debt increases by two percentage points, the return would fall to 1.7% in net-of-fees nominal terms. This seems too harsh a result, given that it’s lower than the outlook for public equity returns. Thus our conclusion is to expect returns from private equity to be in line with returns from public equity.

Another way to approach this question is to determine to what extent private equity returns, in aggregate, can be replicated in public equity markets. Comparing the performance of the Cambridge Associates US Private Equity Index against the MSCI USA Small Cap and MSCI USA Small Cap Value indices, with an added 15% leverage (Display 9), suggests a potential route to generate private equity returns through public market investments. There are divergences over the cycle, but the close link in the long run implies that a forecast for the average private equity return being in line with that of small-cap equities seems like a good assumption.

One final point about future returns: buying a private equity fund is not exactly the same as investing in an active public equity with leverage because the dispersion of outcomes is far wider than it is for public equity active managers. That is, there’s a high degree of "selection alpha" offered. Asset owners who are in a position to benefit from it and who may have first call on better funds can still benefit from such an allocation. However, this implies that, for many investors in private equity, there’s scope for a disappointing outcome below this expected average performance.

What are the key takeaways from this section on private equity?

  • There are good reasons to expect that average future returns from private equity will be below historical levels—and are more likely to be in line with those of small-cap indices.
  • Fund selection is crucial and can add value within private equity given the very wide dispersion of fund returns relative to active public equity.
  • The buildup of dry powder indicates the difficulty of deploying capital. Even if some investors think they have access to top-quartile funds, there could be a significant delay in buying access to such returns.
  • Private equity now accounts for the lion’s share of fees paid for alternative investments, leaving an odd juxtaposition between expected average return and fee.
  • Investors should question their motivation to boost private equity exposure. To the extent that it’s viewed as helping with the overall return-diversification problem, they should consider what kinds of risks they really want exposure to—and the most efficient way to gain those exposures.
  • The private equity outlook is a microcosm of a broader point: there’s a benefit to asset owners in decomposing their asset allocation into more cheap, accessible betas and idiosyncratic alpha that warrants an active fee, and to ensure that those allocations are as efficient as possible. This is a move away from explicit delineations among equities, fixed income, alternatives and other asset classes.  

What Is the Future of Private Markets?

If demand for private assets is set to increase, but average investments in private equities might result in disappointment, where should investors look? We see several places where investors can already allocate and new areas emerging that will be more readily available in coming years. 

Private debt stands out as an area likely to see interest. Aside from the empirical attraction of past return evidence, the way the industry tends to segment assets presents another motivation. With an outlook likely to see at least moderate increases in nominal yields (4Q:2021 Institutional Solutions Quarterly: Navigating Post-Pandemic Returns), high-grade fixed income is likely to become highly unattractive for investors seeking a given real return.

There’s been a migration down the quality spectrum within fixed income for years, which corporations have used to issue lower-quality debt in order to fund buyback programs. For some investors, this has also led to larger emerging-market positions. But within the fixed-income universe, the attraction of shifting from high-grade bonds to private debt is likely to grow.

Private debt benefits from its smaller market compared with private equity and a smaller influx of capital in recent years, although the growth rate has sharply picked up. All private equity (including buyout, venture capital and other categories) amounts to US$4.5 billion (Display 10) and private-market closed-end real estate funds are at US$1.1 trillion, but private debt amounts to US$883 billion, though private debt has recently been growing faster than the other categories.

Since September 2004, gross-of-fee nominal annualized returns of US middle market loans have been 9.5% (Display 11), with an annualized volatility of 3.7%. The resulting headline return/risk ratio is high, but this is more a question of how to compare public asset volatility to private asset volatility. There are also drawdown periods such as 2008, 2015 and 2020, which coincide with declines in other risk assets.

For any investor with a short-term liquidity need, these could be the very worst times for diversification to fail. So the attraction of the asset class is intimately linked to investors’ time horizons, but time horizon must be a core part of the investment rationale for private assets anyway, so this shouldn’t be a surprise. 

This asset class also offers exposure to floating-rate loans, which can be an attractive opportunity given the likelihood of rising nominal interest rates. In fact, the vast majority of middle market loans are floating rate.

One caveat is an overall decline in loan quality—a pervasive feature across the economy and, in our view, a direct consequence of the decline in yields and the ensuing desperation of investors. Other contributing factors: an environment that has strongly rewarded equity buybacks (with an associated increase in credit issuance) and a somewhat siloed approach to asset allocation. This approach has seen high-grade fixed income replaced with lower-quality assets that still qualify in the same asset class, from a governance perspective.

One can see this in the way that publicly listed investment-grade credit now has the lowest average rating of any point in the last 20 years. Currently half of investment-grade debt is at the lowest possible rating for investment grade, whereas in the past, the majority had a higher rating (Display 12). Likewise, the proportion of so-called covenant-lite loans has been significantly increasing (Display 13). 

Real Estate Has Been Effective in Moderate Inflation

Real estate is a staple of most private asset strategies and a key overlap with the necessary allocation to real assets in the face of higher inflation. In this note, we focus on just one key portfolio aspect of this allocation: the ability to contribute positive real returns during higher inflation.

In our work on inflation (Assessing the Inflation Trajectory—and Portfolio Responses), we distinguished between moderate inflation rates in the 2%–4% range and inflation rates higher than that. Real estate accessed through various investment channels has tended to deliver positive real returns in these environments (Display 14).

One potential challenge is that real estate’s correlation with equity beta can increase at high levels of inflation—specifically in the case of real estate investment trusts (REITs). However, this correlation really only kicks in at inflation readings above 4%, which we think is less likely over strategic time scales (Display 15). Real estate debt is also an important channel, offering a persistent spread premium versus investment-grade debt (Display 16). Moreover, real estate debt also improves diversification relative to a solely real estate equity position.

Green Infrastructure: Filling a Number of Roles

Green infrastructure is a private asset that helps fulfill ESG pledges, but there are more reasons it’s worth considering. Fundamentally, capital in this area needs to be raised in order to meet developers’ up-front capital expenditure needs. Compared with a public equity market that’s increasingly dominated by capital-light firms with lower up-front capital needs, it opens the possibility of a more natural demand balancing between issuers and capital providers. This could be a fundamental driver of investor returns over the cycle.

The emergence of different pricing structures could make green infrastructure even more attractive. Our outlook is for moderately higher inflation, so hedging inflation risks will become even more important. At the same time, more infrastructure is being built that exposes the owners to market-based power prices, which could make it attractive as part of a broader inflation-hedging portfolio. Rather than owning an ESG-blacklisted commodity as an inflation hedge, delivering green power is a compelling alternative, so this kind of return stream could be in an ESG/inflation sweet spot.

As renewables mature, they’re being pushed toward embracing wholesale power price risks, because as renewable technologies also matured, policymakers migrated from administratively determined prices to competitive auctions. These auctions have further reduced prices, although revenue streams remain fixed. The latest step in the progression is the move toward “subsidy-free” renewables: as a result of either intense competitive bidding (such as offshore wind auctions in Germany) or auction design (such as “subsidy-free” offshore wind auctions in the Netherlands), the winning renewable project no longer has visibility of a fixed revenue stream (Inigo Fraser Jenkins, Deepa Venkateswaran, et al., “Global Quantitative Strategy: Alternative Risk Premia and Power Prices,” Bernstein Research, April 3, 2019). This means that the owner of the asset is exposed to market prices.

Renewable energy has a different type of cost than coal or gas. It tends to have little or no variable costs at the point of production; instead, up-front capex accounts for 70%–80% of the cost of renewable generation. Therefore, renewable developers need to raise capital but likely would prefer not to take on the risk of the volatile revenue stream from delivering power. This leaves a real need for investors willing to assume the risk of changing power prices.


Today, a sizable chunk of projects is still financed under fixed-price subsidy schemes, but we expect a larger proportion (in developed countries) to move to market-based (or "merchant") pricing over time. Display 17 shows the prognosis for renewable power investment under several different scenarios considered by the International Energy Agency (IEA).

Stated Policies Scenario: This is a conservative benchmark for the future because it doesn’t take for granted that governments will reach all announced goals. Instead, it takes a more granular, sector-by-sector look at what has actually been put in place to reach these and other energy-related objectives.

Sustainable Development Scenario: As a “well below 2°C” pathway, the SDS represents a course to the outcomes targeted by the Paris Agreement. In this scenario, all current net-zero pledges are achieved in full, and there are extensive efforts to realize near-term emissions reductions. The SDS assumes that advanced economies reach net-zero emissions by 2050, China by around 2060 and all other countries by 2070 at the latest.

Net Zero Emissions by 2050 Scenario: This IEA scenario shows a somewhat less likely—but more aggressive—path for the global energy sector to achieve net-zero emissions. It doesn’t rely on emissions reductions from outside the energy sector to achieve its goals, but it does assume that nonenergy emissions will be reduced in the same proportion as energy emissions. The NZE is consistent with limiting the global temperature rise to 1.5°C.

What does this mean for portfolios? Exposure to renewables could be attractive for several reasons: (1) It provides exposure to an asset class that is likely to see significant and sustained inflows in coming years; (2) return streams from power delivery could be an attractive inflation hedge; (3) this segment helps meet many ESG goals; and (4) there could be a greater equilibrium between the needs of investors and project developers.

Power prices in Germany have been rising over the past few years (Display 18). We show Germany because in European markets, the process of renewable development and investor interest in taking merchant price risk has moved the furthest. However, we expect this to spread to global markets.

How do these assets fit into a portfolio allocation? We can examine their diversification properties in several ways. In Display 19, we show that the average correlation of power prices with major asset classes and factors has generally been low over the past 15 years. 

There are periods when the correlation between equities and power prices jumps (Display 20), inevitably when their diversifying properties would be most valued—including periods of market stress. However, the amplitude of these correlation spikes is still subdued compared with other assets and tends to be short-lived.

Likewise, the correlation of power prices with overall equity and bond returns has varied substantially over time (Display 21), with the overall low correlation masking periods when it strays from zero. Thus, the diversifying properties depend on the window for measuring investments, but it wouldn’t be realistic to expect that correlations of an asset class are static and unaffected by the macro environment. The evidence implies that the forces acting on this return stream are imperfectly correlated with other key return sources, even in times of stress, and that’s valuable. 

This investment category is still in its infancy, but we’ve seen the start of tangible developments in this field. One example is Norges Bank, which has acquired unlisted assets in renewable energy as described below:

This investment category is still in its infancy, but we’ve seen the start of tangible developments in this field. One example is Norges Bank, which has acquired unlisted assets in renewable energy as described below:

"Unlisted renewable energy infrastructure is a new asset class for the fund, which we invest in to improve the overall diversification of the fund. We look forward to continuing to execute on our investment strategy for unlisted renewable energy infrastructure, says Nicolai Tangen, Chief Executive Officer at Norges Bank Investment Management."4

Carbon Is Becoming More Popular

Carbon is another nascent ESG-linked asset class gaining popularity recently (Display 22). Similar to the power prices discussed earlier, carbon will also likely play a dual role in investors’ portfolios—providing a hedge against rising inflation and helping achieve ESG goals. As a result, we expect institutional investors to allocate more to carbon in the future, alongside other real assets and private alternatives. Because parts of this asset class are publicly traded—for example via public futures—carbon sits right at the cusp of public and private asset-allocation components. 

Over the past 10 years or so, the correlation of carbon with key asset classes has been close to zero (Display 23), proving that it has been an effective portfolio diversifier.  

However, as with the power delivery prices we showed earlier, the correlation time varies and can turn significantly positive during market stresses, particularly with respect to equity and equity factors (Displays 24 and 25). Nevertheless, since late 2014, the correlation with any of the key asset classes has never been higher than 0.5. 

Tokenization 

If green infrastructure is an emerging new asset that’s rapidly becoming mainstream, then tokenized real assets are the next new asset type at an even earlier stage of development. We present it here as a future development rather than a realistic current opportunity.

The attention on digital assets has mainly focused on cryptocurrencies; we’ve laid out the case for and against their inclusion in asset allocation in the recent black book, Inflation and the Shape of Portfolios. However, we think the real opportunity for the investment industry lies with tokenization.

Our view perhaps differs from the more common one expressed by evangelists for digital assets. For us, the story isn’t just that the technology is innovative. The key aspect from an asset-allocation perspective is that this technology has arrived at exactly the moment when asset-owner demand for real asset exposure is about to soar.

Tokenization refers to issuing digital tokens that represent ownership of an asset. This process enables the "financialization" of assets that have been difficult to invest in. It also could reduce costs and improve access for private assets that are already theoretically investable, such as real estate and infrastructure. The advantages are greater ease of fractional ownership, the possibility of shorter settlement times and automation of some aspects of the compliance process. All this may improve liquidity.

Furthermore, it’s possible that, in time, the fractionalization of ownership could point to a way of solving the problem we outlined at the beginning of this note: How should individuals saving for retirement respond to a shift in the return-diversification opportunity set into private markets? Tokenization might at least solve the problem of access, though it doesn’t solve issues of governance and the need for regulation of such assets.

Tokenization of real assets could, theoretically, lead to a larger pool of assets that behave like asset-backed securities (ABS). The World Economic Forum has forecast that tokenized assets will far surpass ABS in terms of market size (Display 26). In Display 27, we show that ABS have historically been an important part of the ability to hedge inflation.

Looking at the Big Picture

Are Real Assets, Inflation Hedging and ESG Necessarily in Conflict? A Warning from Berlin

Inflation is probably the preeminent strategic and tactical macro question for investors, and a prime force in accelerating a migration into private assets. Meanwhile, any investment outlook will likely place ESG as a key transformative force driving capital reallocation and product development. At the macroeconomic level, these two forces are linked, because we would assert that ESG is inflationary.

  1. Consumers (at least when surveyed) say they’re happy to pay higher prices for ESG-friendly products.
  2. An abrupt drop in upstream commodity investment contributes to rising commodity prices.
  3. If the world is serious about the "S" in ESG, wages for low earners are set to rise, and their long-term path would be sustainably higher—perhaps even leading to universal basic income.
  4. A "green" label likely allows political sign-off for a significant deployment of fiscal firepower.
But are these two great forces—ESG and inflation—in conflict when one considers a portfolio?
 
Many "knee-jerk" inflation hedges have a prima facie clash with ESG—energy equities, commodities and bitcoin, for example (the latter is only an arguable inflation hedge). We’ve made a case before that some of this apparent clash is likely temporary, and may be resolved in due course (Assessing the Inflation Trajectory—and Portfolio Responses). We expect that some of the issue will be resolved as ESG investing evolves—for example, migrating from blunt exclusion to engagement.

Also, the underlying assets may evolve. For instance, energy companies could eventually evolve to be part of the solution, and cryptocurrencies could evolve to become a proof of stake rather than proof of work (reducing power consumption in the process).

However, if we focus on private assets, there are potential clashes that may only be starting. A significant part of traditional private/real asset exposure is in commodities, which have a direct clash with the "E" of ESG. But other issues are emerging too. Real estate is another sizable component of real asset exposure (especially for the subset of private real assets), and there’s a potential clash brewing around the "S" in ESG.

Voters in Berlin, Germany, recently backed a referendum to forcibly buy housing owned by large property companies. Berlin has become a particular real estate flashpoint, because the vast majority of homes are rented, not owned, and large real estate companies own a significant share of them. While the Berlin case has been a particularly high-profile case, similar issues have arisen elsewhere, such as the presence of large commercial investors in the US 6 and Ireland. 7

A sociopolitical backdrop of growing pressure to respond to inequality implies that this issue will likely escalate rather than diminish. We made the case in a recent black book that inequality will be a critical force driving policy in coming years, 8 so there are two sides to the fairness debate: There’s the question of how investors can equitably access return streams that are becoming more important in retirement saving. And there’s the question of clashing interests among stakeholders in those assets, a topic we’ll revisit in a forthcoming essay on the nature of the commons and its impact on investing.


This landscape doesn’t make a clash inevitable, but investors should expect that if the underlying notion of ESG is taken seriously, it may have a material impact on return streams beyond considerations of environmental impact and fair wages. Directionally, all of this implies a downward force on the return to holders of capital.

There’s a more subtle ESG role too. We can measure ex-post returns empirically, but what about the ex-ante case for superior returns? We think the ability to affect corporate change is a crucial aspect of ESG. Traditionally, public equity investing accepts that ownership and control are separated, while private equity investing relies on control. We note that this distinction is now weakened because an increasing number of private deals don’t involve exclusive control.

Does this distinction still hold today?

We think that the industry’s evolution to incorporate ESG principles is changing it. We’ve argued before9 that a key distinction will emerge between passive ESG and active ESG. An approach to ESG investing that relies on simple screening will be considered passive in the future. Active ESG investing, by contrast, is about engaging with underlying companies. Driving corporate change is also a plausible route to idiosyncratic alpha, which we think is the only alpha that can command an active fee within an asset class.10 This implies that the distinction between active public and private investment will decline, though this will play out over many years.

How Big Should Private Asset Allocations Be? 

All of this leads to a question: How much should investors allocate to private assets? Clearly, this percentage depends greatly on an investor’s desired risk level, liquidity needs and other governance concerns. But, with those caveats in mind, we can at least lay out a provisional way to analyze what a private asset allocation might need to look like in the future—and how that differs from the past.

With hindsight (an oversimplifying viewpoint, as always), high returns from public equities and public debt combined with their negative correlation already made high Sharpe ratios achievable, but integrating a small allocation to private equity (especially if one is permitted to perpetuate the myth that stale prices are synonymous with diversification) boosted Sharpe ratios even more.

In Display 28, we show how this setup made it relatively easy to achieve the 7% return on plan assets targeted by US pension plans, on average. At the top right, we show the past 10-year return/risk for a 60/40 portfolio of global equities and US bonds, a ratio that had already been abnormally high since 1980 versus the century before that. We also show that it has been possible to raise that ratio even more by introducing alternative exposures, in this case represented by a 10% allocation to private equity and real estate.

How would these allocations evolve if one were to substitute expectations for future returns, variance and covariance? We mark what we think is the likely path of such a portfolio in the display. Our world view implies that a portfolio of 42% equities, 28% government bonds, 10% credit, 10% REITs and 10% private equity would see its Sharpe ratio decline from 1.34 over the past decade to 0.75 now.

An unconstrained optimizer, given our forecasts for lower returns on other assets and the need to maximize diversification, would naturally imply a very large weight on private assets excluding private equity. But that would be unrealistic, and as we’ve said, we don’t think all that diversification is real anyway. More fragile public market liquidity coupled with a high allocation to private assets has clear dangers, especially when “tail events” that reduce public liquidity are likely to be the same macro events that would affect the ability to sell private assets.

The usual response to this result would be to simply limit the private asset weight and optimize on the remaining assets. Such an approach isn’t very useful for our purposes here; ideally, one would like to make a normative statement about weights rather than impose them a priori.

One conclusion from this work is that there’s scope for private debt allocations to grow. Adding a 10% private debt allocation improves the return/risk characteristics of a portfolio. The exact size of these allocations for a given investor will depend on investment policy constraints, but the allocations we show here should be seen as a guide for the scale of allocations needed and their impact on overall portfolio return/risk.

Display 28 also shows the interaction of our predictions for return streams and various big-picture assumptions for potential allocations to types of private assets. In this case, we choose to maintain the “fiction” that private asset volatility is low because these assets are not marked to market, which fits the way most investors approach assessing return and risk. A more appropriate risk measure is probably the risk of a shortfall in a combined drawdown tail event. Adding other forms of private assets can help the overall portfolio, so we think this will remain the direction of travel for the industry. However, even then, the return/risk trade-off is set to be lower than it has been historically.

This analysis can be thought of as a provisional sketch for the shape of portfolios in a world of higher allocations to private assets. The radical work really needs to be done not in forecasting asset returns but in determining the governance structure, need for liquidity and appropriate time horizon for portfolios that span public and private assets.

Conclusion

The macro environment implies that many investors are likely to increase their allocation to private assets. Lower returns in public markets, less diversification and a risk of higher inflation all point in this direction. We also recognize that return expectations might have gone too far for some parts of the private asset universe.

On one level, the action point is to increase private asset exposure, but look beyond private equity. This note provides explicit pointers in this regard, both in the range of alternatives and how large allocations should be. Specific potential allocations include private debt, real estate and green infrastructure. In time, we think this universe will likely extend to tokenized real assets.

But the key action point is really at a deeper level: governance, risk measurement, liquidity and time horizon. These aspects involve an explicit view of the types of risk investors want exposure to; simply buying private assets for leverage or asset betas are probably not good reasons. Likewise, the inflation-hedging aspect should be seen as part of a package that includes listed asset-class and factor investments too.

Is the risk of private assets measured correctly? Standard deviation of returns seems woefully inadequate; joint tail risks, given stressed macro outcomes, seems more appropriate, especially if they raise the risk of a hardship outcome for end beneficiaries. If some investors are attracted to private assets by the lack of mark to market, that’s fine; but please be consistent and don’t mark to market the liquid holdings in a portfolio, either.

Private asset exposure is also another example of the growing prominence of alpha sources, as opposed to returns from beta. We’ve made the point more generally that if one has evidence of persistent skill at alpha generation, then as expected returns from betas fall, alpha sources mechanically play a larger portfolio role. While the ability to identify idiosyncratic alpha for managers of private assets might take longer to be accepted than for active managers in public markets, the very wide dispersion of returns shows that the value from any skill at manager selection becomes a large part of overall return.

From a policy perspective, the first response to this landscape will likely be to ensure that regulated investors have appropriate liquidity. As private assets expand into new areas, especially digital, appropriate levels of transparency and protection are necessary too. But there’s a bigger-picture policy question here: If private assets are needed to achieve a given level of return per unit of risk, what happens to smaller investors and individuals who may find it hard to access them? Digital tokens may enable more fractionalized ownership, but the need to protect individual investors and the desire to avoid unduly high fees for small investors means that, even with fractional ownership, small investors face hurdles in making large allocations to private assets.

The model of the past 30 years in countries such as the US and the UK has been to progressively pass more retirement-saving risk to individuals, which could arguably work when public markets could supply the requisite returns. This model was helped by the rise of passive investing, and indeed the two trends were mutually reinforcing. But if the next-generation portfolio design to achieve the requisite high real returns requires a significant private asset allocation, it could challenge the model of pushing retirement risk onto individuals.

This also raises questions of fairness and inequality. When mass-market savers could buy cheap passive exposure that was expected to generate high returns, the system might have worked (of course, many people couldn’t even afford to buy that). However, if only high-net-worth individuals can buy the relevant exposure, it seems to cut against the political zeitgeist, to say the least.

At the end of the day, we suspect that the hard division between public and private assets, in the way investments are partitioned, may fade, just as we think the hard asset-class silos of the industry are starting to fade. However, this evolution will take time. In the meantime, the flow from public to private markets is likely to continue for the foreseeable future.

1 Niki Anderson, Lewis Webber, Joseph Noss, Daniel Beale and Liam Crowley-Reidy, “The resilience of financial market liquidity,” Financial Stability Paper, no. 34 (October 2015).

Yakov Amihud, “Illiquidity and Stock Returns: Cross-Section and Time-Series Effects,” Journal of Financial Markets 5, no. 1 (2002): 31–56.

Andrew Ang, Dimitris Papanikolaou, and Mark M. Westerfield, “Portfolio Choice with Illiquid Assets,” Management Science 60, no. 11 (2014): 2737–61.

https://www.nbim.no/en/the-fund/news-list/2021/first-investment-in-renewable-energy-infrastructure/

5 https://www.bloomberg.com/news/articles/2021-09-26/berlin-vote-to-expropriate-big-property-holdings-headed-for-win

6 https://www.nytimes.com/2020/03/04/magazine/wall-street-landlords.html

7 https://www.bloomberg.com/news/articles/2021-05-17/private-equity-spends-big-on-irish-homes

8 https://www.alliancebernstein.com/solution/human-dancer 

9 Inigo Fraser Jenkins, Anna Larson, et al.., “Fund Management Strategy: It's about engagement, stupid,” Bernstein Research, February 24, 2017

10 https://www.alliancebernstein.com/content/dam/global/insights/insights-whitepapers/alpha-beta-inflation.pdf 


About the Authors