Analysis Services
Our suite of quantitative tools and our dedicated specialists provide deeper insights into the dynamics that drive portfolio performance.
Muni Bond Analysis
How do you build a Muni Bond portfolio today?
Analyze your clients’ municipal bond portfolios to gain a deeper understanding of their structure and exposure to various risk/return sources as well as the impact of transitioning the portfolio to a separately managed account (SMA). We provide three levels of analysis:
-
Portfolio Analysis
Assesses a muni portfolio’s maturity, credit quality and other key characteristics, comparing them to those of an AB municipal SMA portfolio. Delivery time: 24 hours.
-
Shock Analysis
Illustrates the impact of an interest rate increase or decrease on the prices of bonds in a muni portfolio. Delivery time: 24 hours.
-
Hold/Sell Analysis
Shows the order in which the portfolio-management team would sell out of bonds delivered in kind to an AB municipal SMA portfolio. Delivery time: 36-48 hours.
Fixed Income Risk Factor Analysis
We analyze a bond portfolio’s historical performance to estimate the risk factors that drive its performance, focusing on sensitivity to three main factors:
-
Interest Rates
Changes in market interest rates.
-
Credit/Growth
Risk assets, including high-yield and investment-grade credit, emerging sovereigns and currency.
-
Volatility
Changes in bond market volatility.
Equity Factor Analysis
We analyze a client’s equity holdings to uncover potential hidden risks within the portfolio—and identify ways to better position it to align with the client’s objectives. Our analysis focuses on sensitivity to three main factors:
-
Portfolio Factor Exposures
Various risk/return factors.
-
Stock and Sector Exposures
Sector and stock exposures’ influence on returns.
-
Overall Characteristics
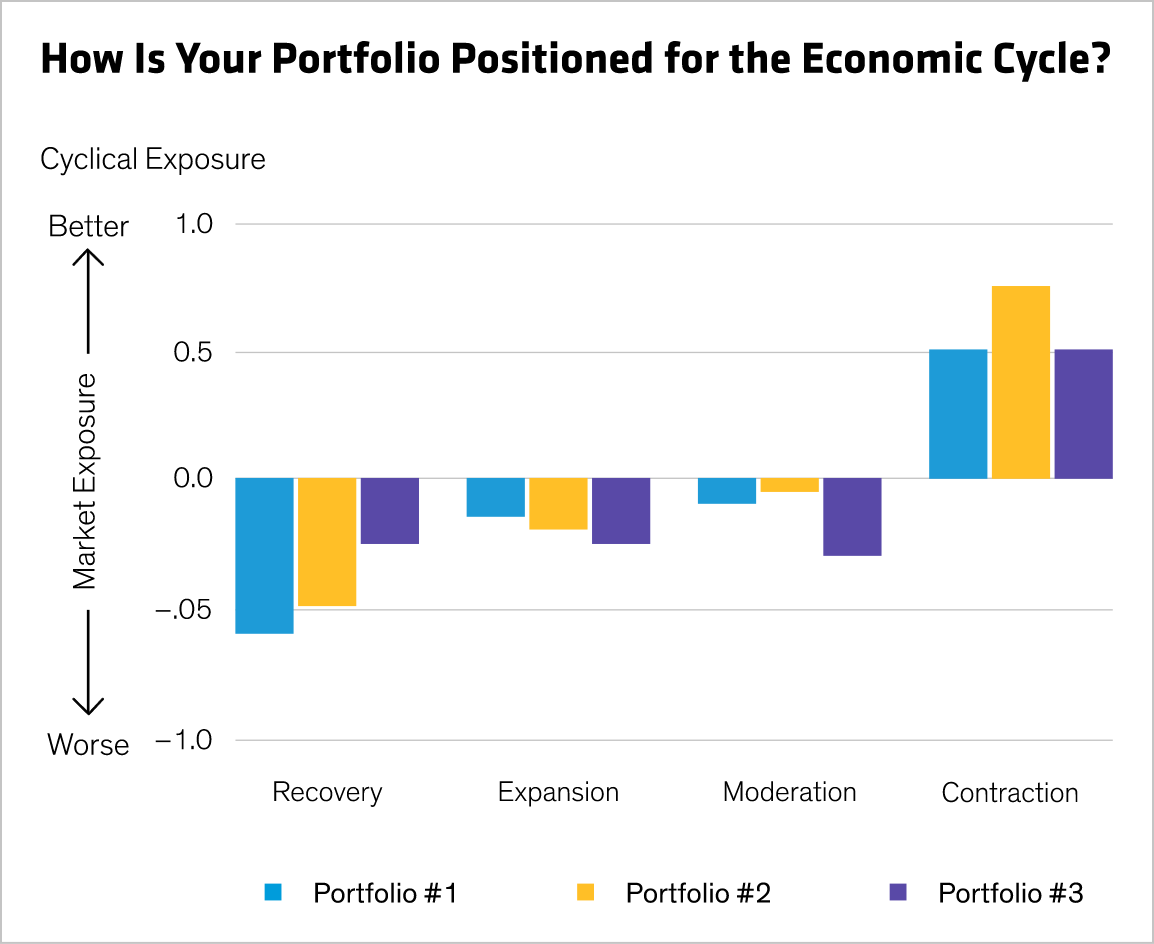
Correlation to capital-gains profile and positioning for different economic cycles.

Gain access to AB's Analysis Services!
Thank You


