Investors continue to question whether US equity valuations are too high, particularly for growth companies and versus other global markets. But standard valuation metrics don’t tell the whole story. Understanding the cost of capital can provide essential insight on valuing stocks.
US stocks have surged this year. The S&P 500 Index advanced by 28% through November 30 and is trading at a price/forward earnings ratio of nearly 18×, about 24% higher than its 15-year average. Yet standard P/E metrics are narrow indicators that don’t capture the macroeconomic or market context of valuation. To do that, investors need to go back to basics and look at what really drives the value of securities.
Expected Return: The Ultimate Measure of Value
What is the expected return of an investment? This is perhaps the most important question that investors ask when buying any security. By assuming the risk of an investment, we want to know what we’re likely to get back. A security’s expected return is a function of its price movements, which adjust constantly until buyers and sellers are in balance.
For some investments, the expected return is easy to observe. For example, if you lend $100 to your friend for an agreed 6% interest rate, you’ll be getting a return of $6. With corporate and government bonds, the electronically quoted yield is what you can expect to earn by holding the bond to maturity.
Stocks provide no such clarity. That’s because there’s no direct way to observe a stock’s expected return. But the “Cost of Capital” (COC) can help. It measures the rate of return that a company must earn on its investments to be profitable. As such, the COC is a good measure for the expected return of each stock—and the market.
The Risk-Free Rate
To interpret the COC, start with the so-called risk-free rate (RFR). The RFR is the near certain reward—or cost, if rates are negative—that you can expect from holding onto your cash instead of bearing the risks of investment. By buying a stock or bond, an investor decides to forgo the RFR. What determines the RFR is a hotly debated subject among economists. However, a good proxy for the RFR is the yield on the 10-year Treasury Inflation Protected Security (TIPS), a bond issued by the Federal Government that guarantees an after-inflation return. That yield is just above zero today.
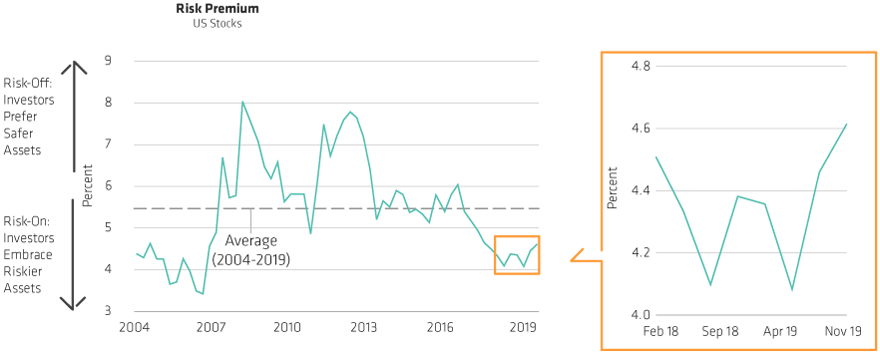
Since stocks are riskier than the TIPS, the COC should always exceed the RFR. This spread between them is the so-called risk premium (Display). So, if the COC is 7% and the RFR 2%, then the risk premium is 5 percentage points.
.png)

