-
The views expressed herein do not constitute research, investment advice or trade recommendations and do not necessarily represent the views of all AB portfolio-management teams.
Should Investors Worry About US Earnings?
14 May 2018
2 min read
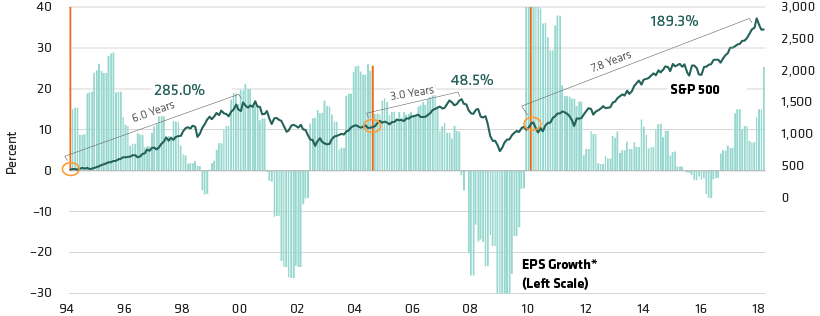
US Stocks Have Risen Well After Earnings Growth Peaked

Through April 30, 2018
EPS: earnings per share
*EPS growth chart truncated at 40% and at –30% for visual clarity. In the following periods, EPS growth or contraction exceeded 40%: March 1994, 92.7%; March 2009, –66.7%; January 2010, 43.1%; February 2010, 65.5%; March 2010, 202.7%; April 2010, 49.2%; May 2010, 53.7%; June 2010, 53.4%.
Source: Bloomberg, S&P and AllianceBernstein (AB)
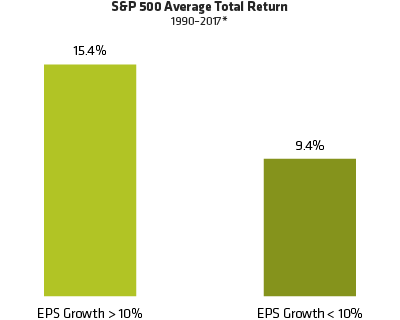
Stock Returns Have Been Resilient in Lower-Earnings Environments

As of December 31, 2017
*Years when earnings growth was greater than 10% include: 2017, 2011, 2010, 2006, 2005, 2004, 2003, 1999, 1995, 1994 and 1993. Both top-down and bottom-up EPS growth >10% in all those years.
Source: Bloomberg, S&P and AllianceBernstein (AB)
About the Author
