-
The views expressed herein do not constitute research, investment advice or trade recommendations and do not necessarily represent the views of all AB portfolio-management teams.
Looking Forward, Looking Back
10 Charts After 10 Years
18 March 2019
5 min read

Global Stocks: MSCI World Index
Number of Days Up/Down By At Least 1%

As of December 31, 2018
Source: MSCI and AllianceBernstein (AB)

Tracking Populism
Left Display as of December 31,2017. Right display based on data downloaded in 3Q 2018.
*Percentage of respondents in each age cohort who believe that having a democratic political system is fairly bad or very bad.
Source: Timbro (data extracted using WebPlotDigitizer) and World Value Survey

Percentage of Companies Referencing UN Sustainable Development Goals in Public Filings

As of December 18, 2018
Source: Bloomberg and AllianceBernstein (AB)


Source: International Energy Agency


Through December 31, 2018
Historical and current analyses do not guarantee future results.
*Trailing 12-month aggregate ratio for the index. EBITDA is earnings before interest, tax, depreciation and amortization.
Source: Bloomberg, Bloomberg Barclays, S&P and Alliance Bernstein (AB)

Equity Return Spread: High-Leverage Stocks vs. Low Leverage Stocks
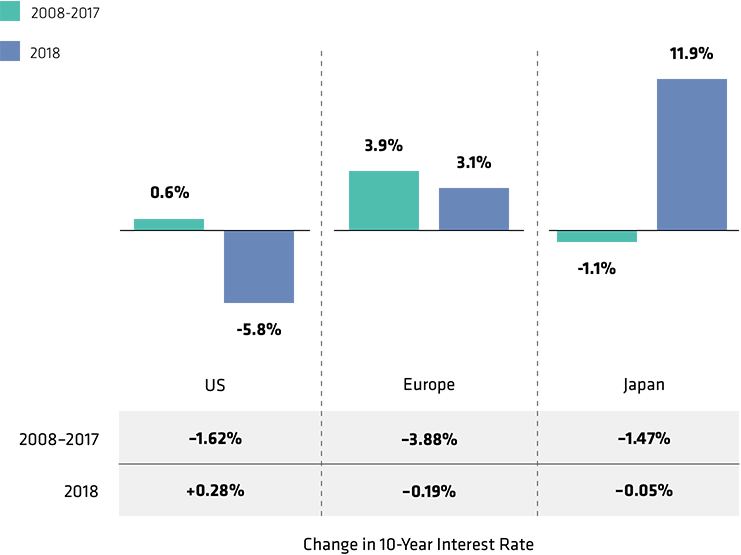
As of December 31, 2018
US Stocks are based on companies listed in Russel 1000. European stocks are based on companies listed in MSCI Europe. Japanese stocks are based on companies listed in MSCI Japan. Hedged equity returns of high-leverage and low-leverage companies. High leverage is the top quintile of companies measured by net debt/equity and low leverage is the bottom quintile of companies based on net debt/equity. Net debt/equity is the total of long-term and short-term debt minus cash equivalents divided by the book value of the company’s equity.
10-year interest rates represented by US Treasury, German bund and Japanese government bond.
Source: MSCI, Russell Investments, S&P, Compustat, Worldscope and AllianceBernstein (AB)


As of December 31, 2017
Historical analysis does not guarantee future results.
Source: CEIC Data, National Bureau of China & AllianceBernstein (AB)

US Government Balance and Unemployment

Through December 2018
Source: Thomson Reuters Datastream


As of June 30, 2018
*Government, households and nonfinancial companies.
Source: Haver Analytics

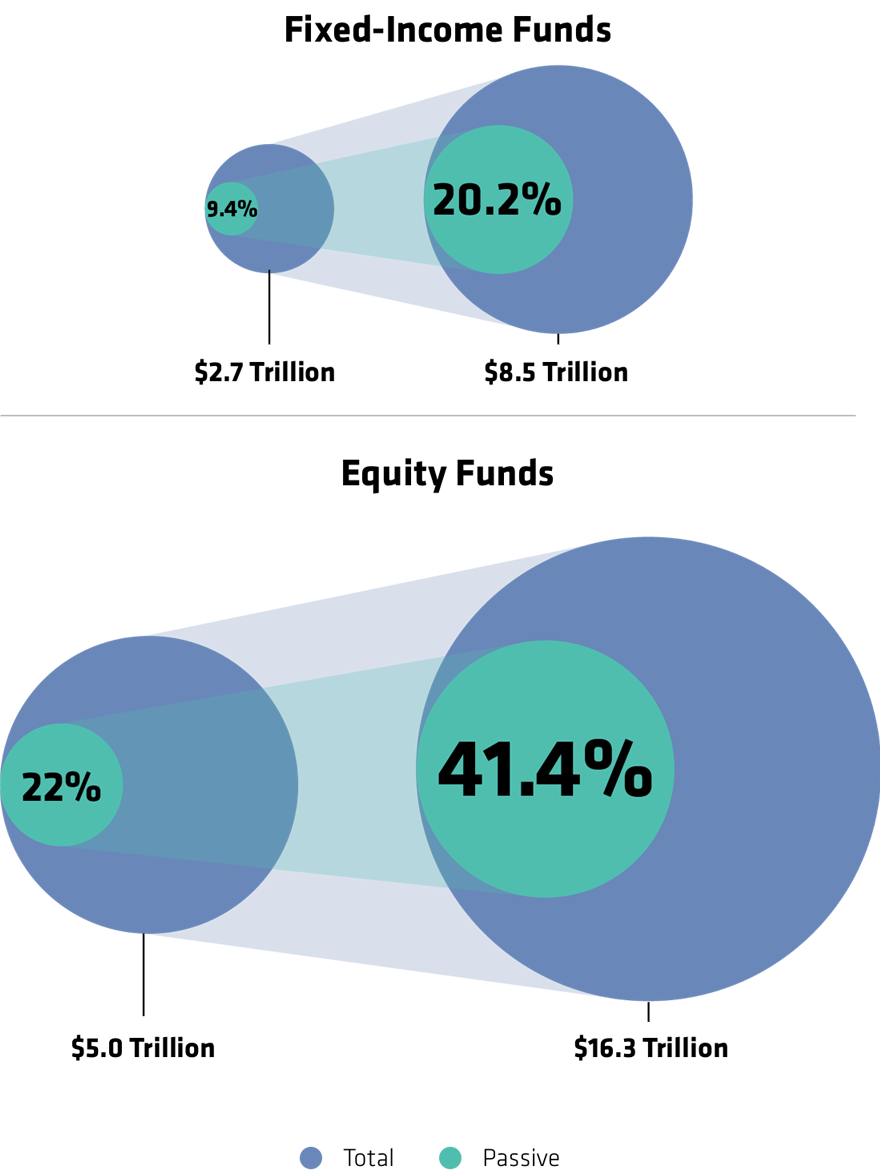
As of December 31, 2018
Based on Morningstar Worldwide open-ended money market and exchange-traded funds, excluding funds of funds and feeder funds, and obsolete funds
Source: Morningstar and AllianceBernstein (AB)
-
MSCI makes no express or implied warranties or representations, and shall have no liability whatsoever with respect to any MSCI data contained herein.
The MSCI data may not be further redistributed or used as a basis for other indices or any securities or financial products. This report is not approved, reviewed or produced by MSCI.
More For You

Equity Outlook: Finding Silver Linings in Very Cloudy Markets
As volatility rises, staying invested is a strategic priority for capturing long-term return potential in a broadening market.

Fixed-Income Outlook: Six Strategies to Thrive in Turbulent Times
As stocks dip, bonds are stepping up.

A World in Flux: Managing Evolving Risks in Equity Markets
Risk management is being put to the test in 2025. How can equity portfolio teams cope with multiple hazards across equity markets this year?